How to Read and Analyze a Stock Market Research Report Like a Pro Trader
Stop skipping to the target price. Learn how to dissect fundamental investment theses, technical triggers, risk invalidations, and regulatory disclosures in institutional research reports.

📌 Executive Key Takeaways
Never Look at Targets First — Looking only at the target price without understanding the underlying thesis and assumptions is the fastest way to misinterpret research.
The Invalidation Clause — Every credible research report specifies the exact technical or macro conditions under which the thesis becomes invalid.
Valuation Context — Learn whether growth expectations are already priced into the current stock multiple before deploying capital.
Regulatory Disclosures — Always review the mandatory disclosure section at the end to identify any financial interest or institutional holding.
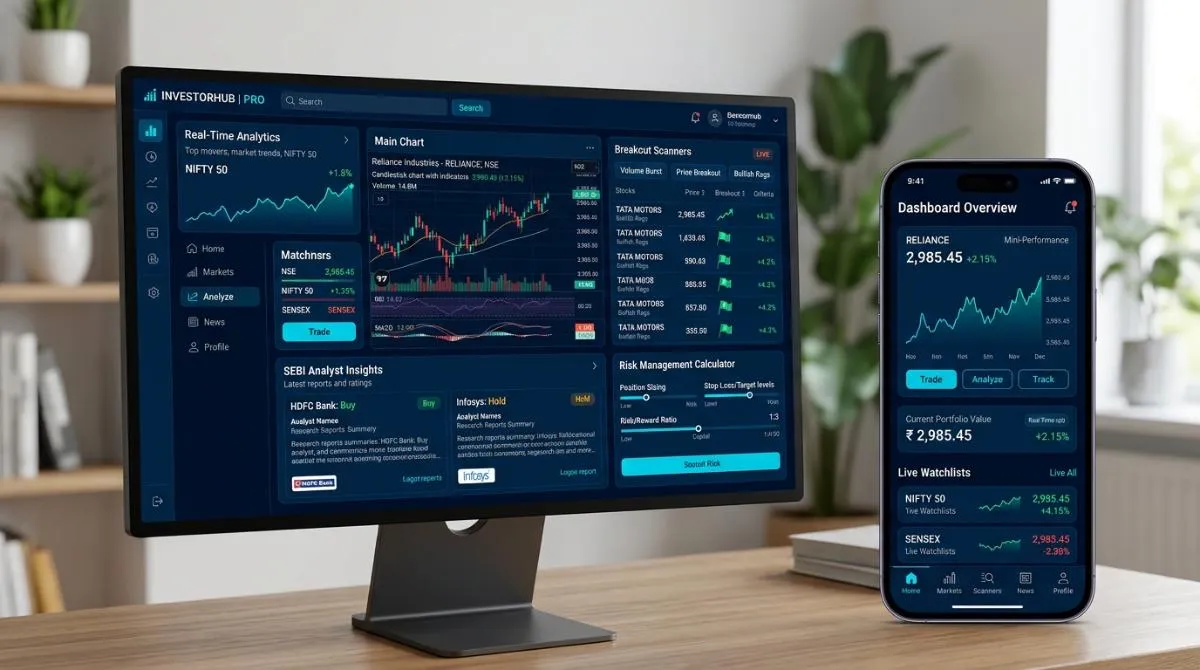
Infographic: The anatomy and structural breakdown of a SEBI research report.
1 The 5 Core Components of a Research Report
Institutional brokerage houses, SEBI Research Analysts, and independent research desks produce comprehensive reports daily. Beginners usually make the fatal error of scrolling directly to the last line: "Target: ₹1,800 (+25%)" and blindly buying the stock.
A professional trader reads a research report like a lawyer reads a contract. A high-quality report consists of 5 distinct pillars:
Executive Summary & Investment Rationale: The 3-to-4 sentence core thesis explaining why this company will outperform its sector.
Industry & Macro Tailwinds: Structural sectoral trends (e.g., government capex, PLI schemes, raw material price drops).
Financial Forensics & Valuations: Historical earnings, revenue growth CAGR, margin expansion, and debt-to-equity trends.
Technical & Volume Structure: Multi-timeframe chart patterns, institutional accumulation zones, and key breakout levels.
Risks & Regulatory Disclosures: Internal and external risks that could derail the forecast.
2 Deciphering Fundamental Valuation Metrics

Financial Metric | What It Tells You | Ideal Benchmark |
|---|---|---|
P/E Ratio (Price to Earnings) | How much you are paying per ₹1 of company net profit. | Compare with historical 5-year median and industry peers. |
ROCE (Return on Capital Employed) | Efficiency with which management generates returns on deployed capital. | Consistently > 15% to 20% indicates strong competitive moat. |
Debt-to-Equity Ratio | Solvency risk and reliance on borrowed funds. | < 0.5 for non-financial companies is considered conservative and safe. |
Free Cash Flow (FCF) | Actual cash remaining after paying capital expenditures (Capex). | Positive and growing alongside accounting net profits. |
3 Technical Confluence: Entry, Invalidation & Targets
Fundamental research tells you WHAT to buy. Technical research tells you WHEN to buy. Even the best fundamental company can correct 20% if bought at an over-extended technical resistance.
Entry Trigger: A specific event, such as a daily close above a multi-month resistance with volume 2x higher than the 20-day average.
Thesis Invalidation (Stop Loss): The exact price point where the bullish structure breaks down (e.g., swing low or 50 EMA breach).
Staged Profit Targets: Resistance levels based on Fibonacci extensions or previous liquidity pools where institutional profit-taking is expected.
4 Stress-Testing the Analyst's Assumptions
Every price target is built on financial modeling assumptions (Discounted Cash Flow or P/E multiples). Ask yourself:
Is the projected 25% revenue growth realistic given historical 12% performance?
What happens if crude oil or raw material prices rise by 15%?
Does the analyst assume interest rates will drop rapidly?
5 The Mandatory Disclosure Section: What to Look For
Under SEBI regulations, every research report must conclude with a comprehensive disclosure table. Ensure:
The analyst desk does NOT have personal holding or financial interest in the security exceeding 1%.
The firm has NOT received investment banking or merchant banking compensation from the issuer in the past 12 months.
No market-making activities are being conducted in the recommended stock.
Frequently Asked Questions
A tactical technical research report is valid until the target or stop-loss is hit (usually 1 day to 4 weeks). A fundamental report remains valid until the next quarterly earnings result or significant corporate event.
Analysts use different valuation models, discount rates, growth projections, and risk weightings, resulting in differing target expectations.
Looking at charts is strongly advised to optimize your entry timing and avoid buying at the exact top of an intraday impulse move.